IBM Tekton Dashboard
Tools Used: Sketch, Craft, InVision, Omnigraffle, Kubernetes, GitHub
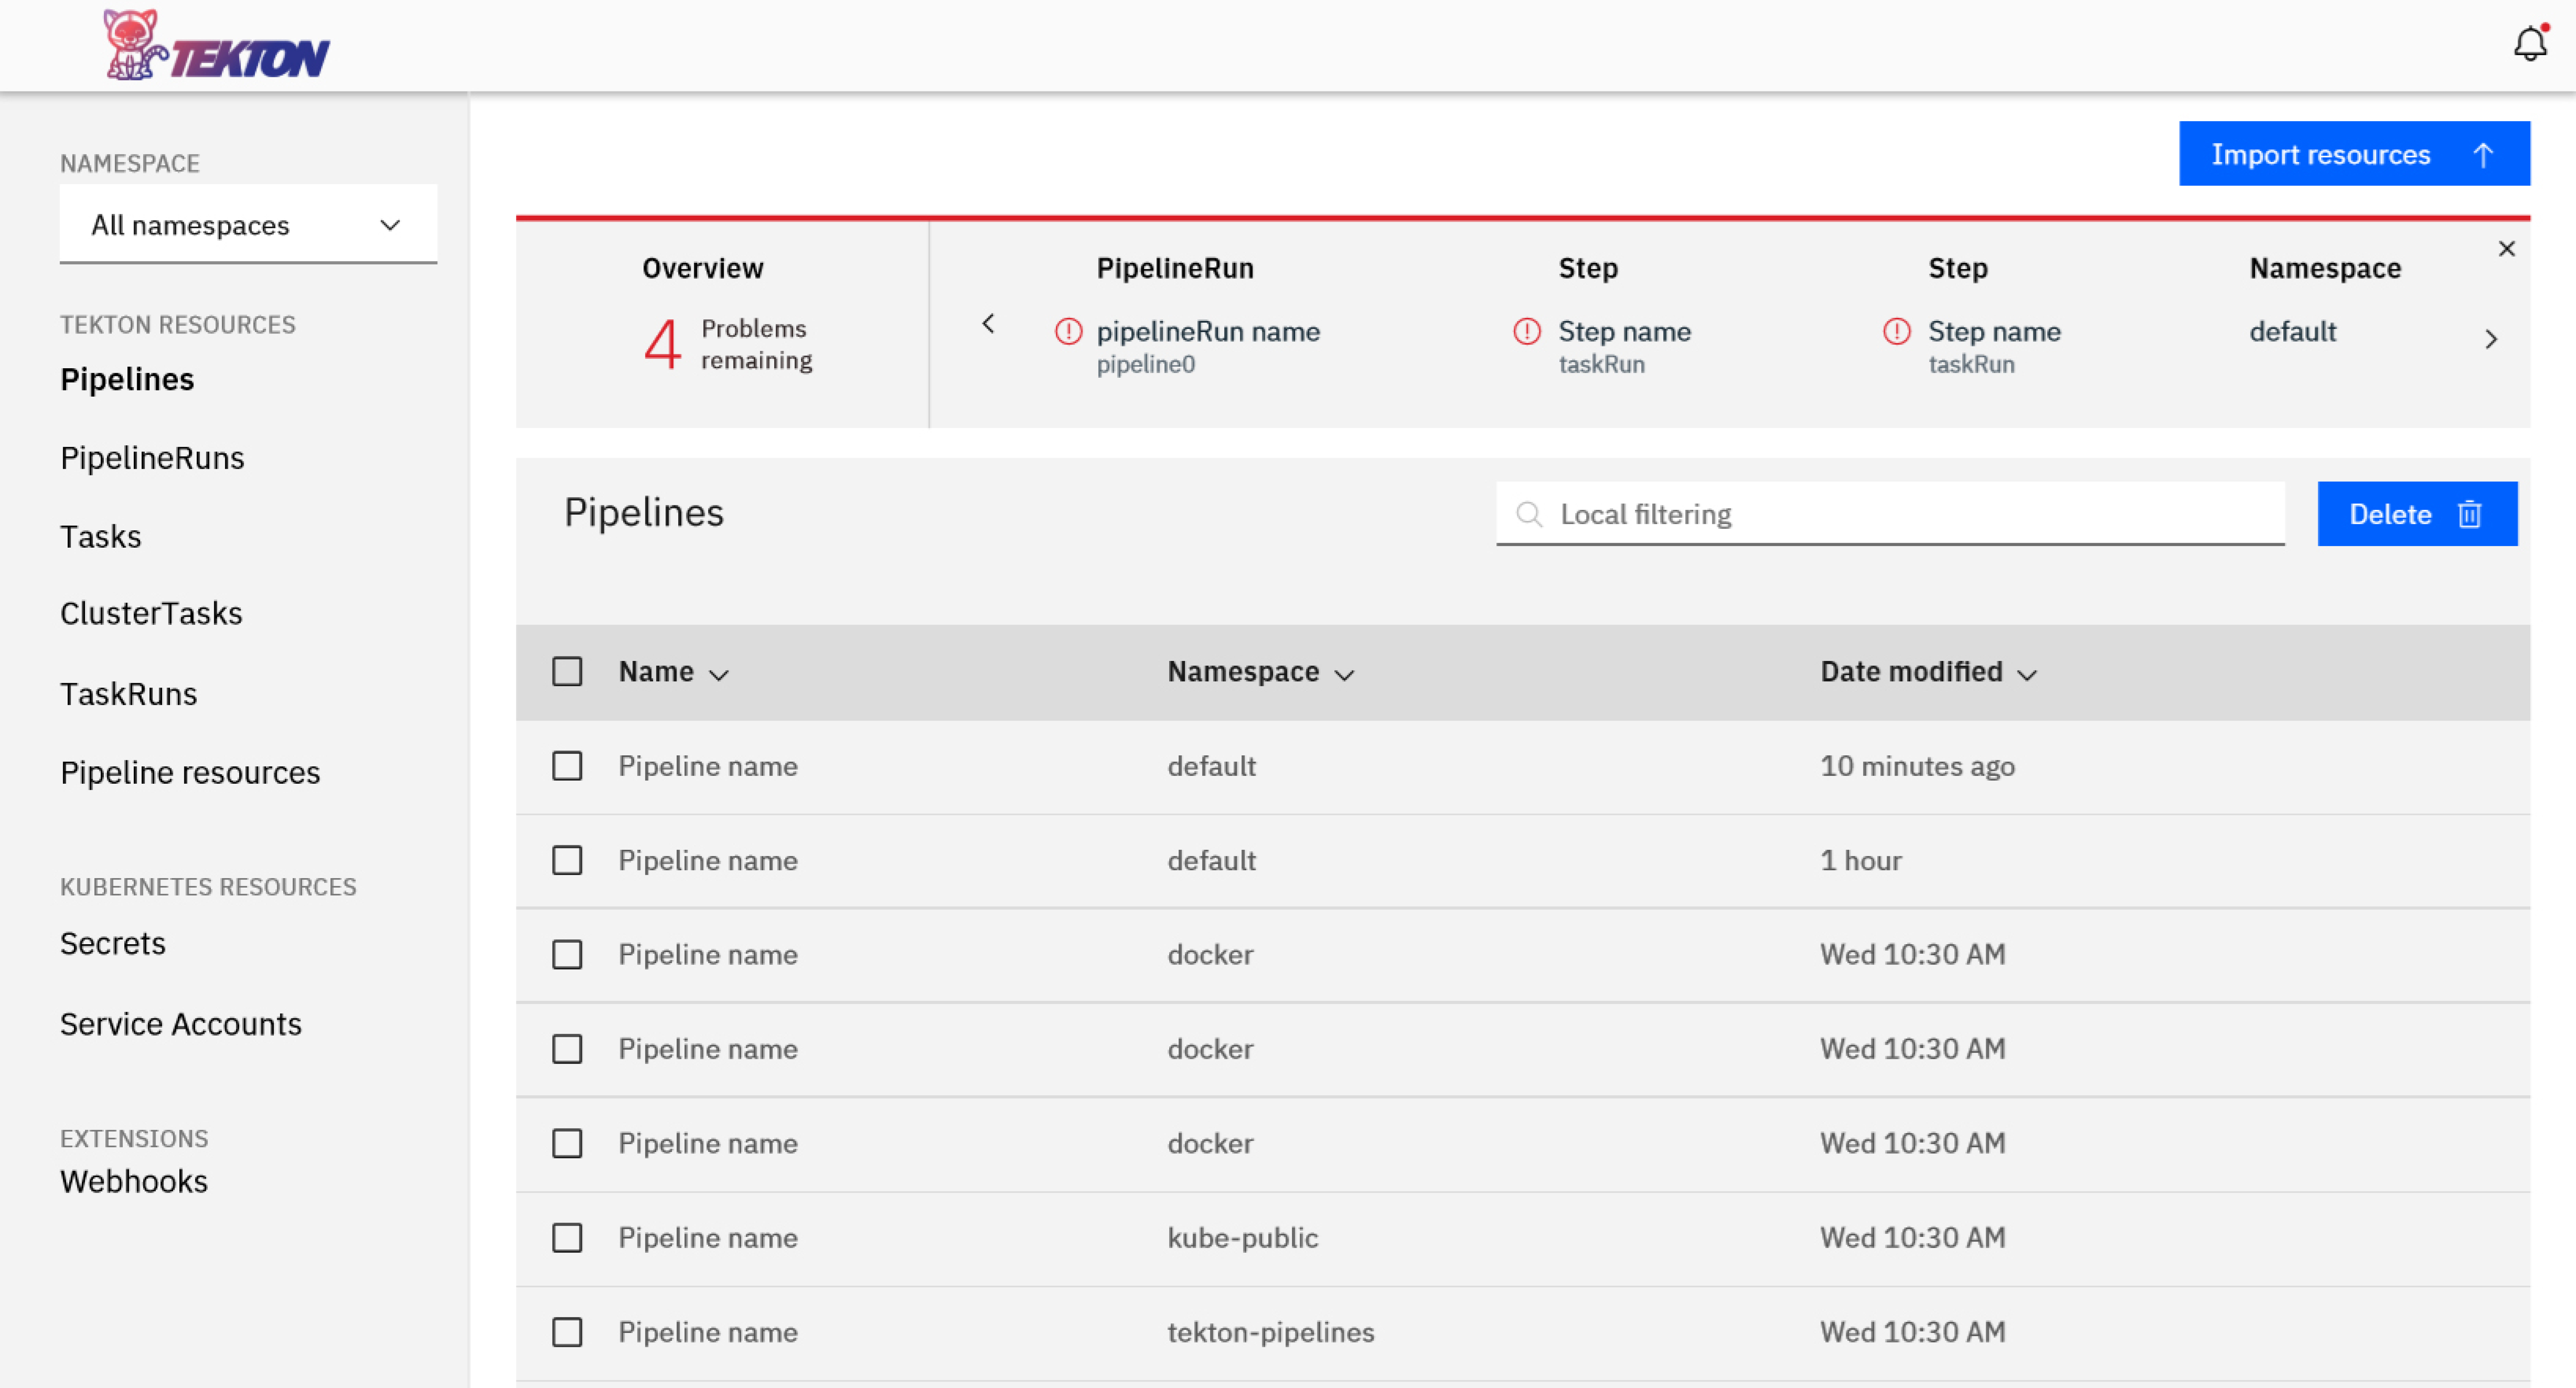
The Tekton Dashboard was a shared effort between IBM and Google to make a visual dashboard for Tekton, an open source CI/CD (continuous interation/continuous delivery) platform for Kubernetes. The dashboard was designed by working with both internal stakeholders and developers from the open source community. We posted designs on GitHub for discussion, prototyped, and shipped in a fast-paced agile enviornment.
My Impact
- The Tekton Dashboard repo on GitHub has been downloaded over 50,000 times!
- Brought the design team and the open source Tekton community together on GitHub
- Helped the design team understand a difficult and extremely technical product
- Taught the engineering team that they could be designers too
- Disco Mode
The Team
- Kim H. - Design Lead
- Michelle W. - UX Design
- Rachel C. - User Research
- Alexandra R. - Visual Design
- Alan U. - UX Design & Prototyping
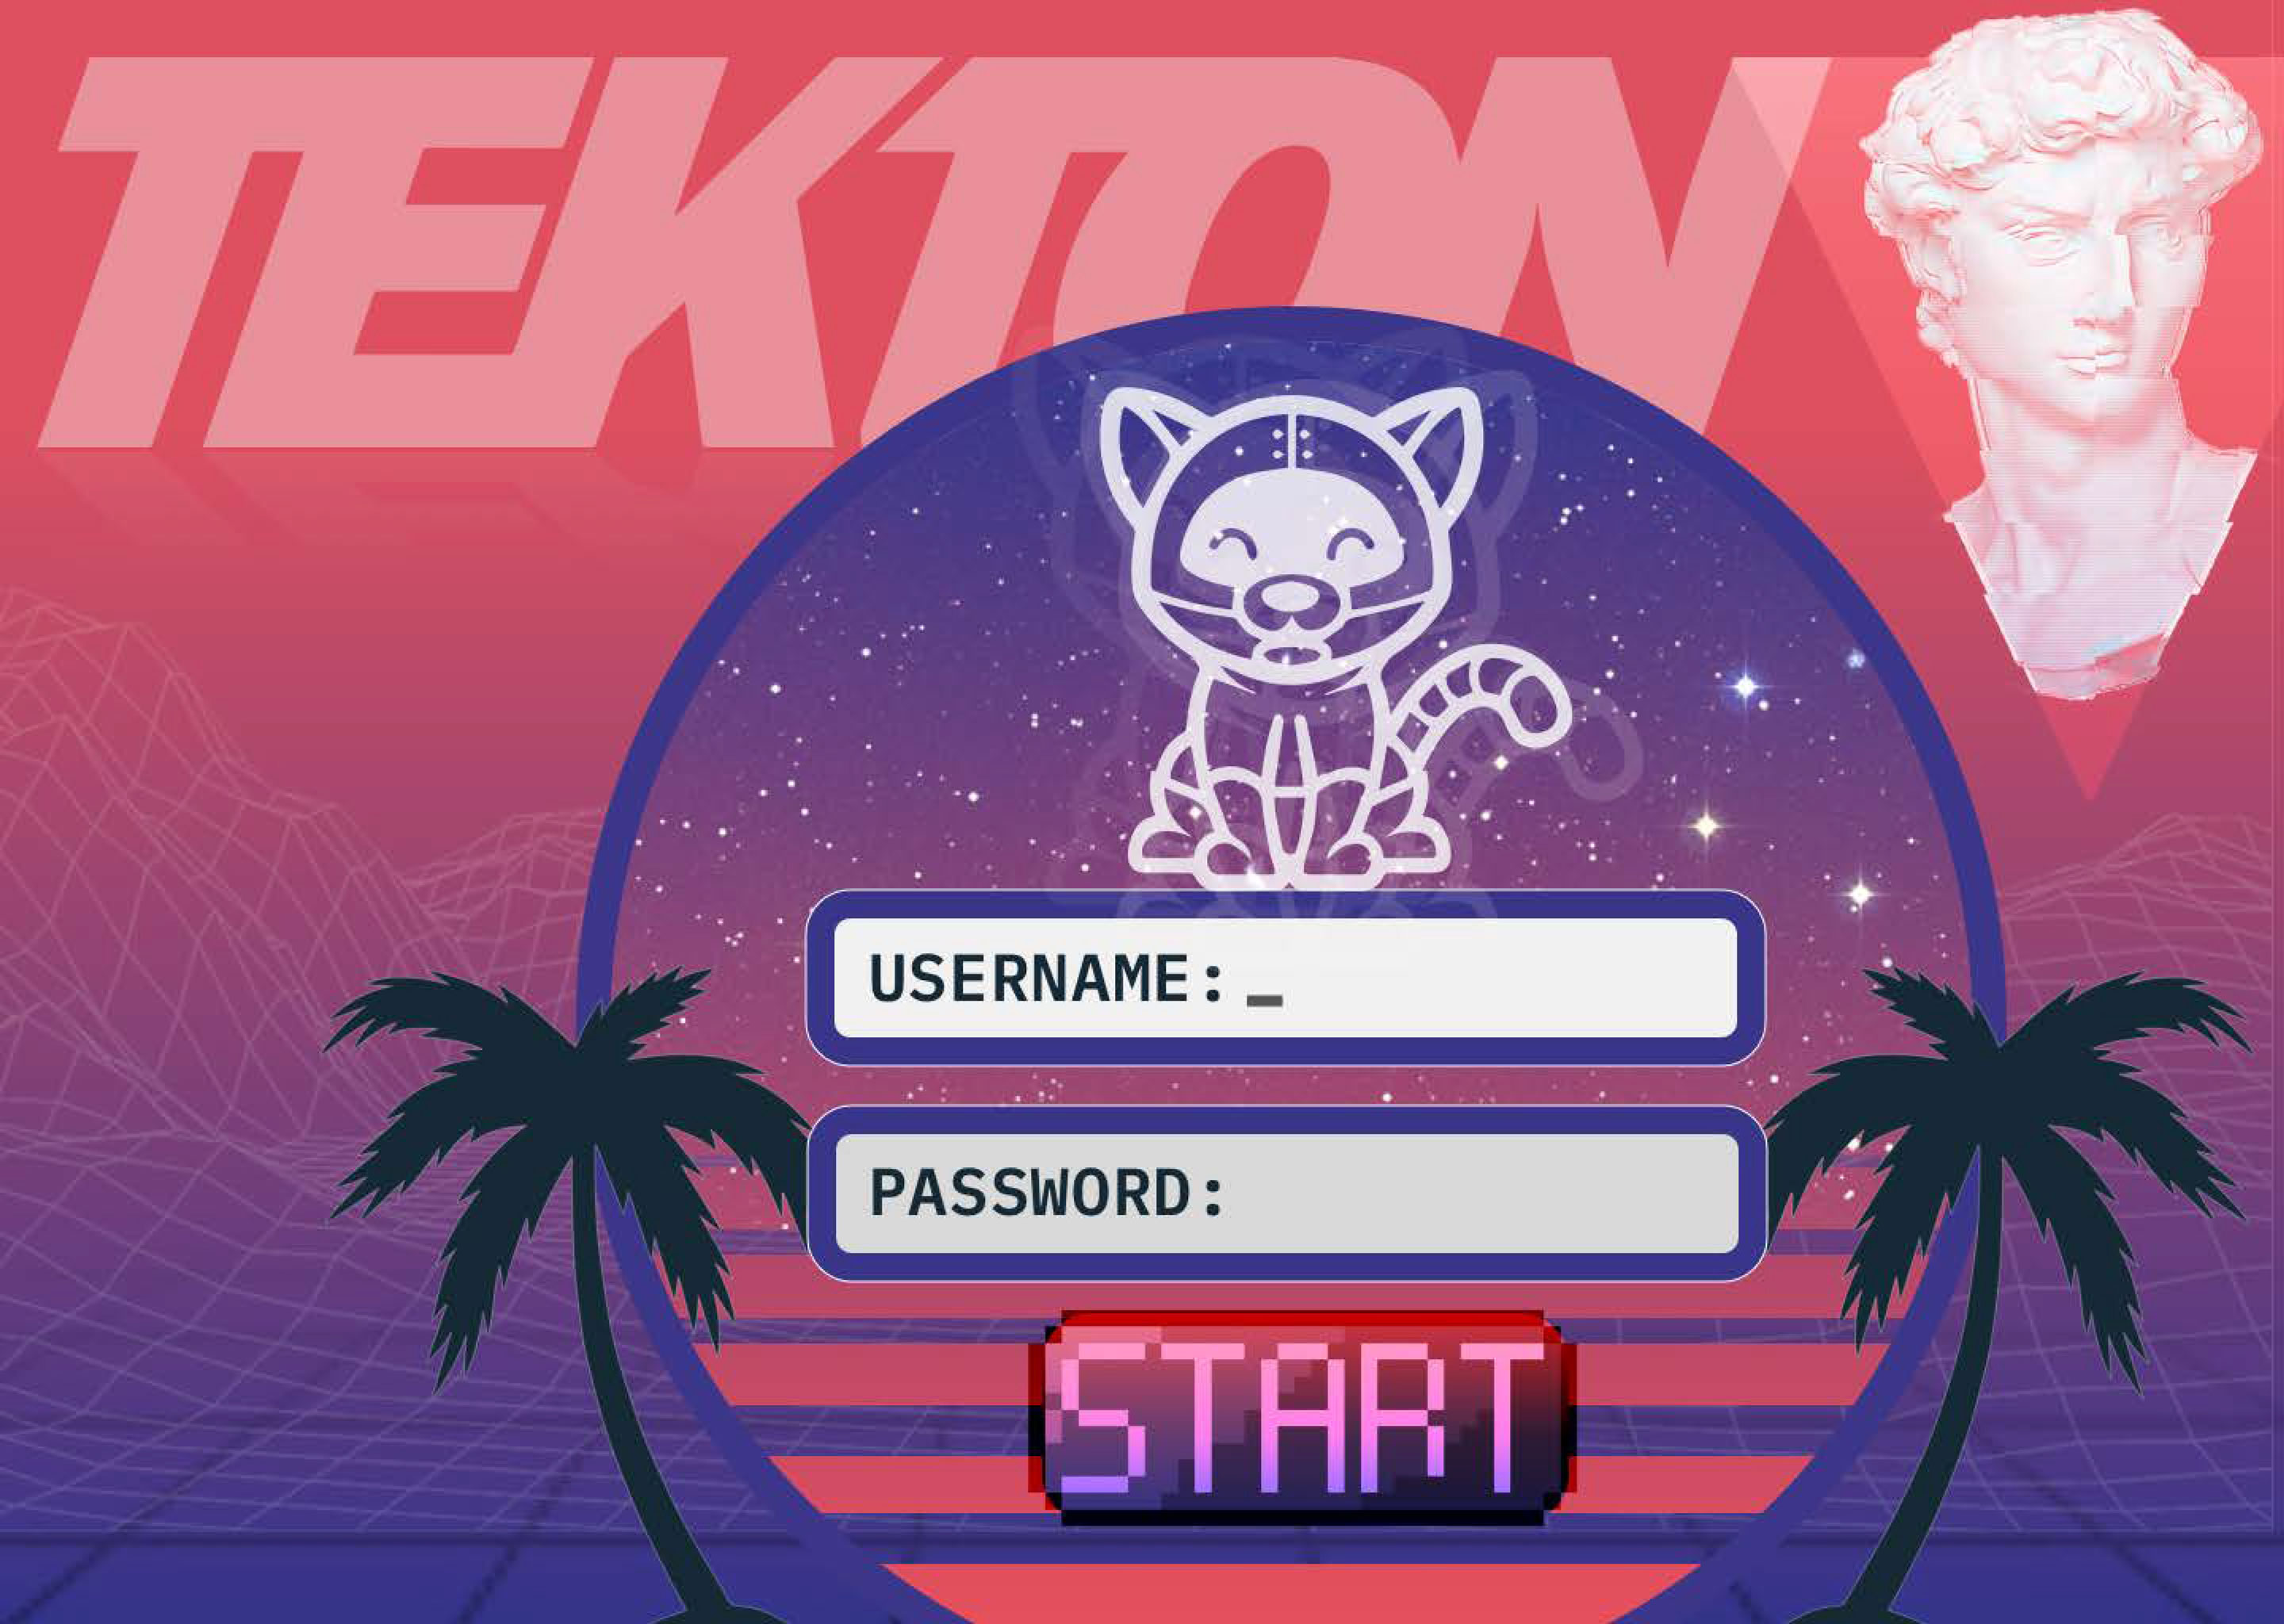
There was actually no login screen for the product at all. Security was managed within Tekton itself.
I designed this as a way to "set the mood" for the product. It was passed around the team as both a joke and then eventually as a design inspriation.
The final result was "Disco mode" which was a fun variation on having a dark mode.
Scenario Mapping
We started by identifying the common user scenarios by talking with the development team, as they were already using this tool. In many ways, this was a tool for developers, by developers so starting with the dev team made sense. In other cases, I wouldn't recommend it. However, our developers had a flair for design so they came ready with the ugliest designs you've ever seen in your life, but they described the functionality and the product use cases very clearly and effectively, so it was a great starting point.
Feature Mapping
The majority of the mapping done in this project was feature mapping between the command line tool that was already written and the functionality as it would be displayed in the GUI. We wanted a 1:1 feature mapping between the CLI and the GUI. Going a step further, we also wanted to directly integrate with a rich command line tool called Kubernetes UI (KUI) so we mapped features between both Tekton, KUI and the Tekton Dashboard. Feature mapping was primarily done in Mural.ly and output in the form of wireframes. Feature mapping was done using Omnigraffle for both Mac and iPad Pro.
KUI - Kubernetes CLI
User Research
Finding users to get feedback from proved to be a relatively simple task. Tekton has an active community of users and the Tekton Dashboard was an officially sanctioned program of the Tekton project, so all we had to do was go onto GitHub and ask them. GitHub provided a place for us to post designs and collect feedback, and allowed them to be discussed on the weekly Tekton Community Call.
Check out the Tekton CD Open Source Community
Wireframe Evolution
Original Wireframes from the Developers
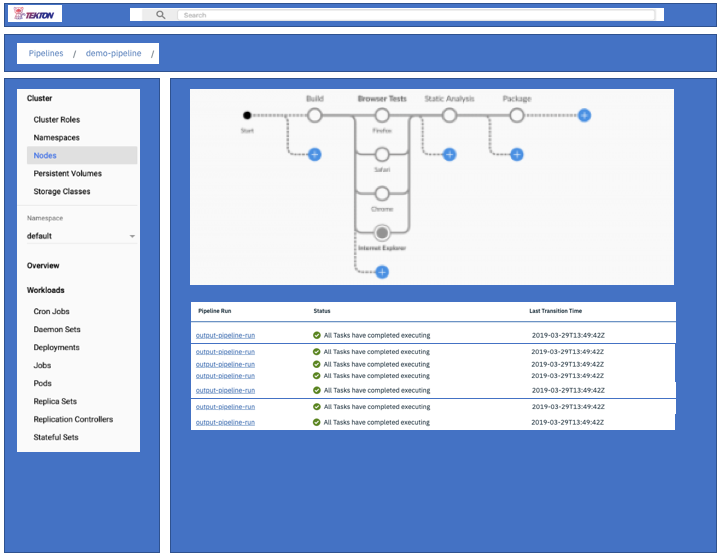
The Design Team's Wireframe
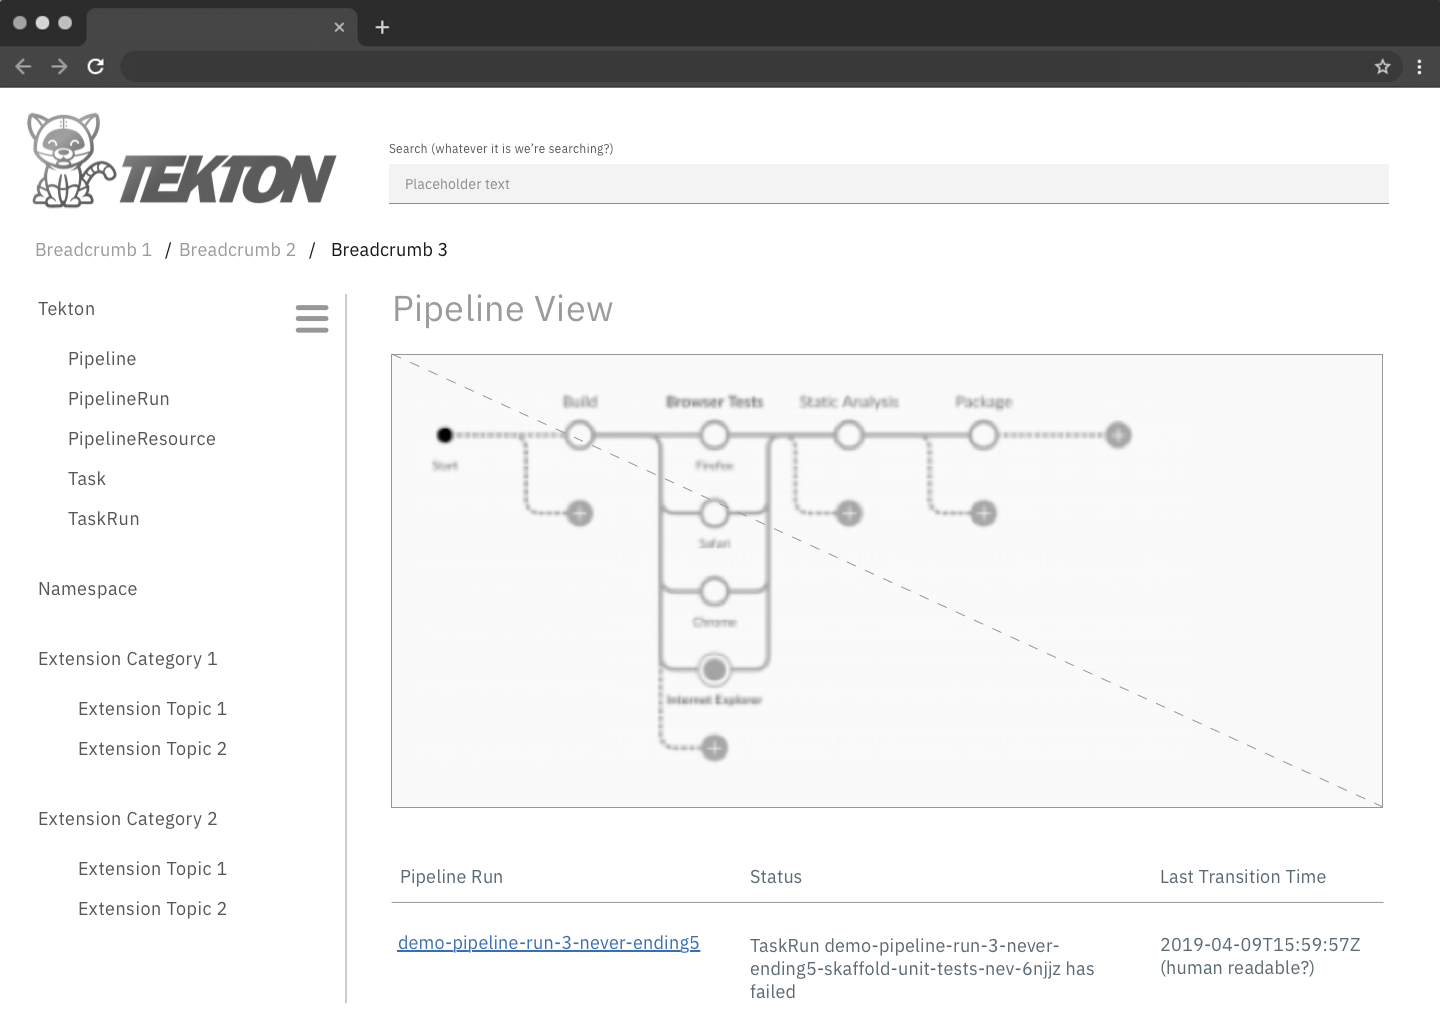
Open Source Community Response
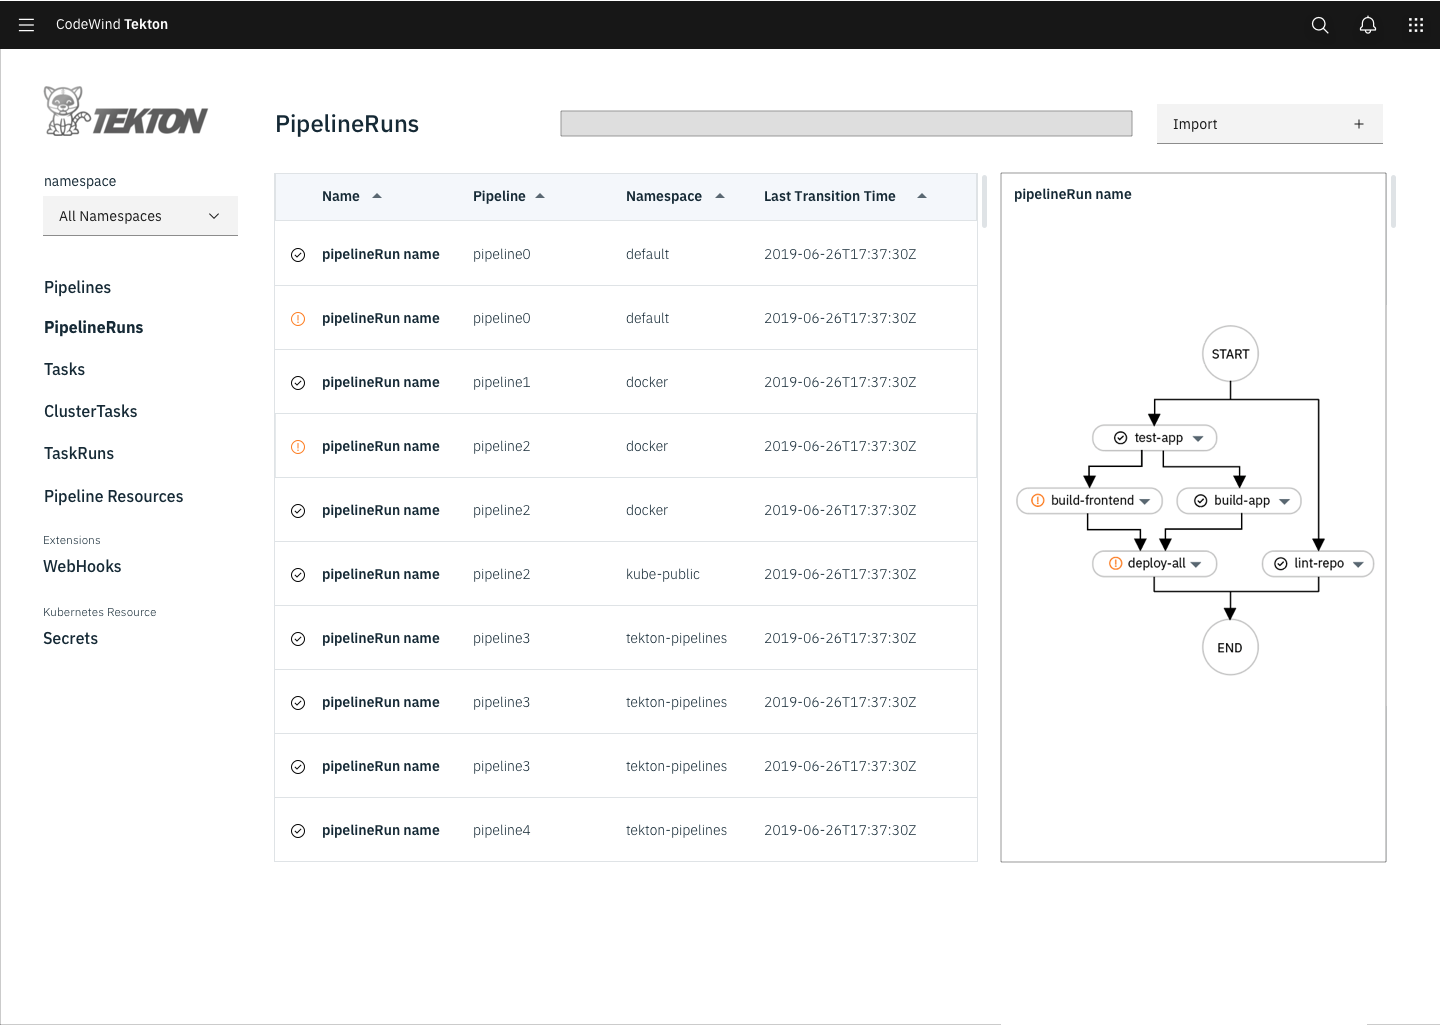
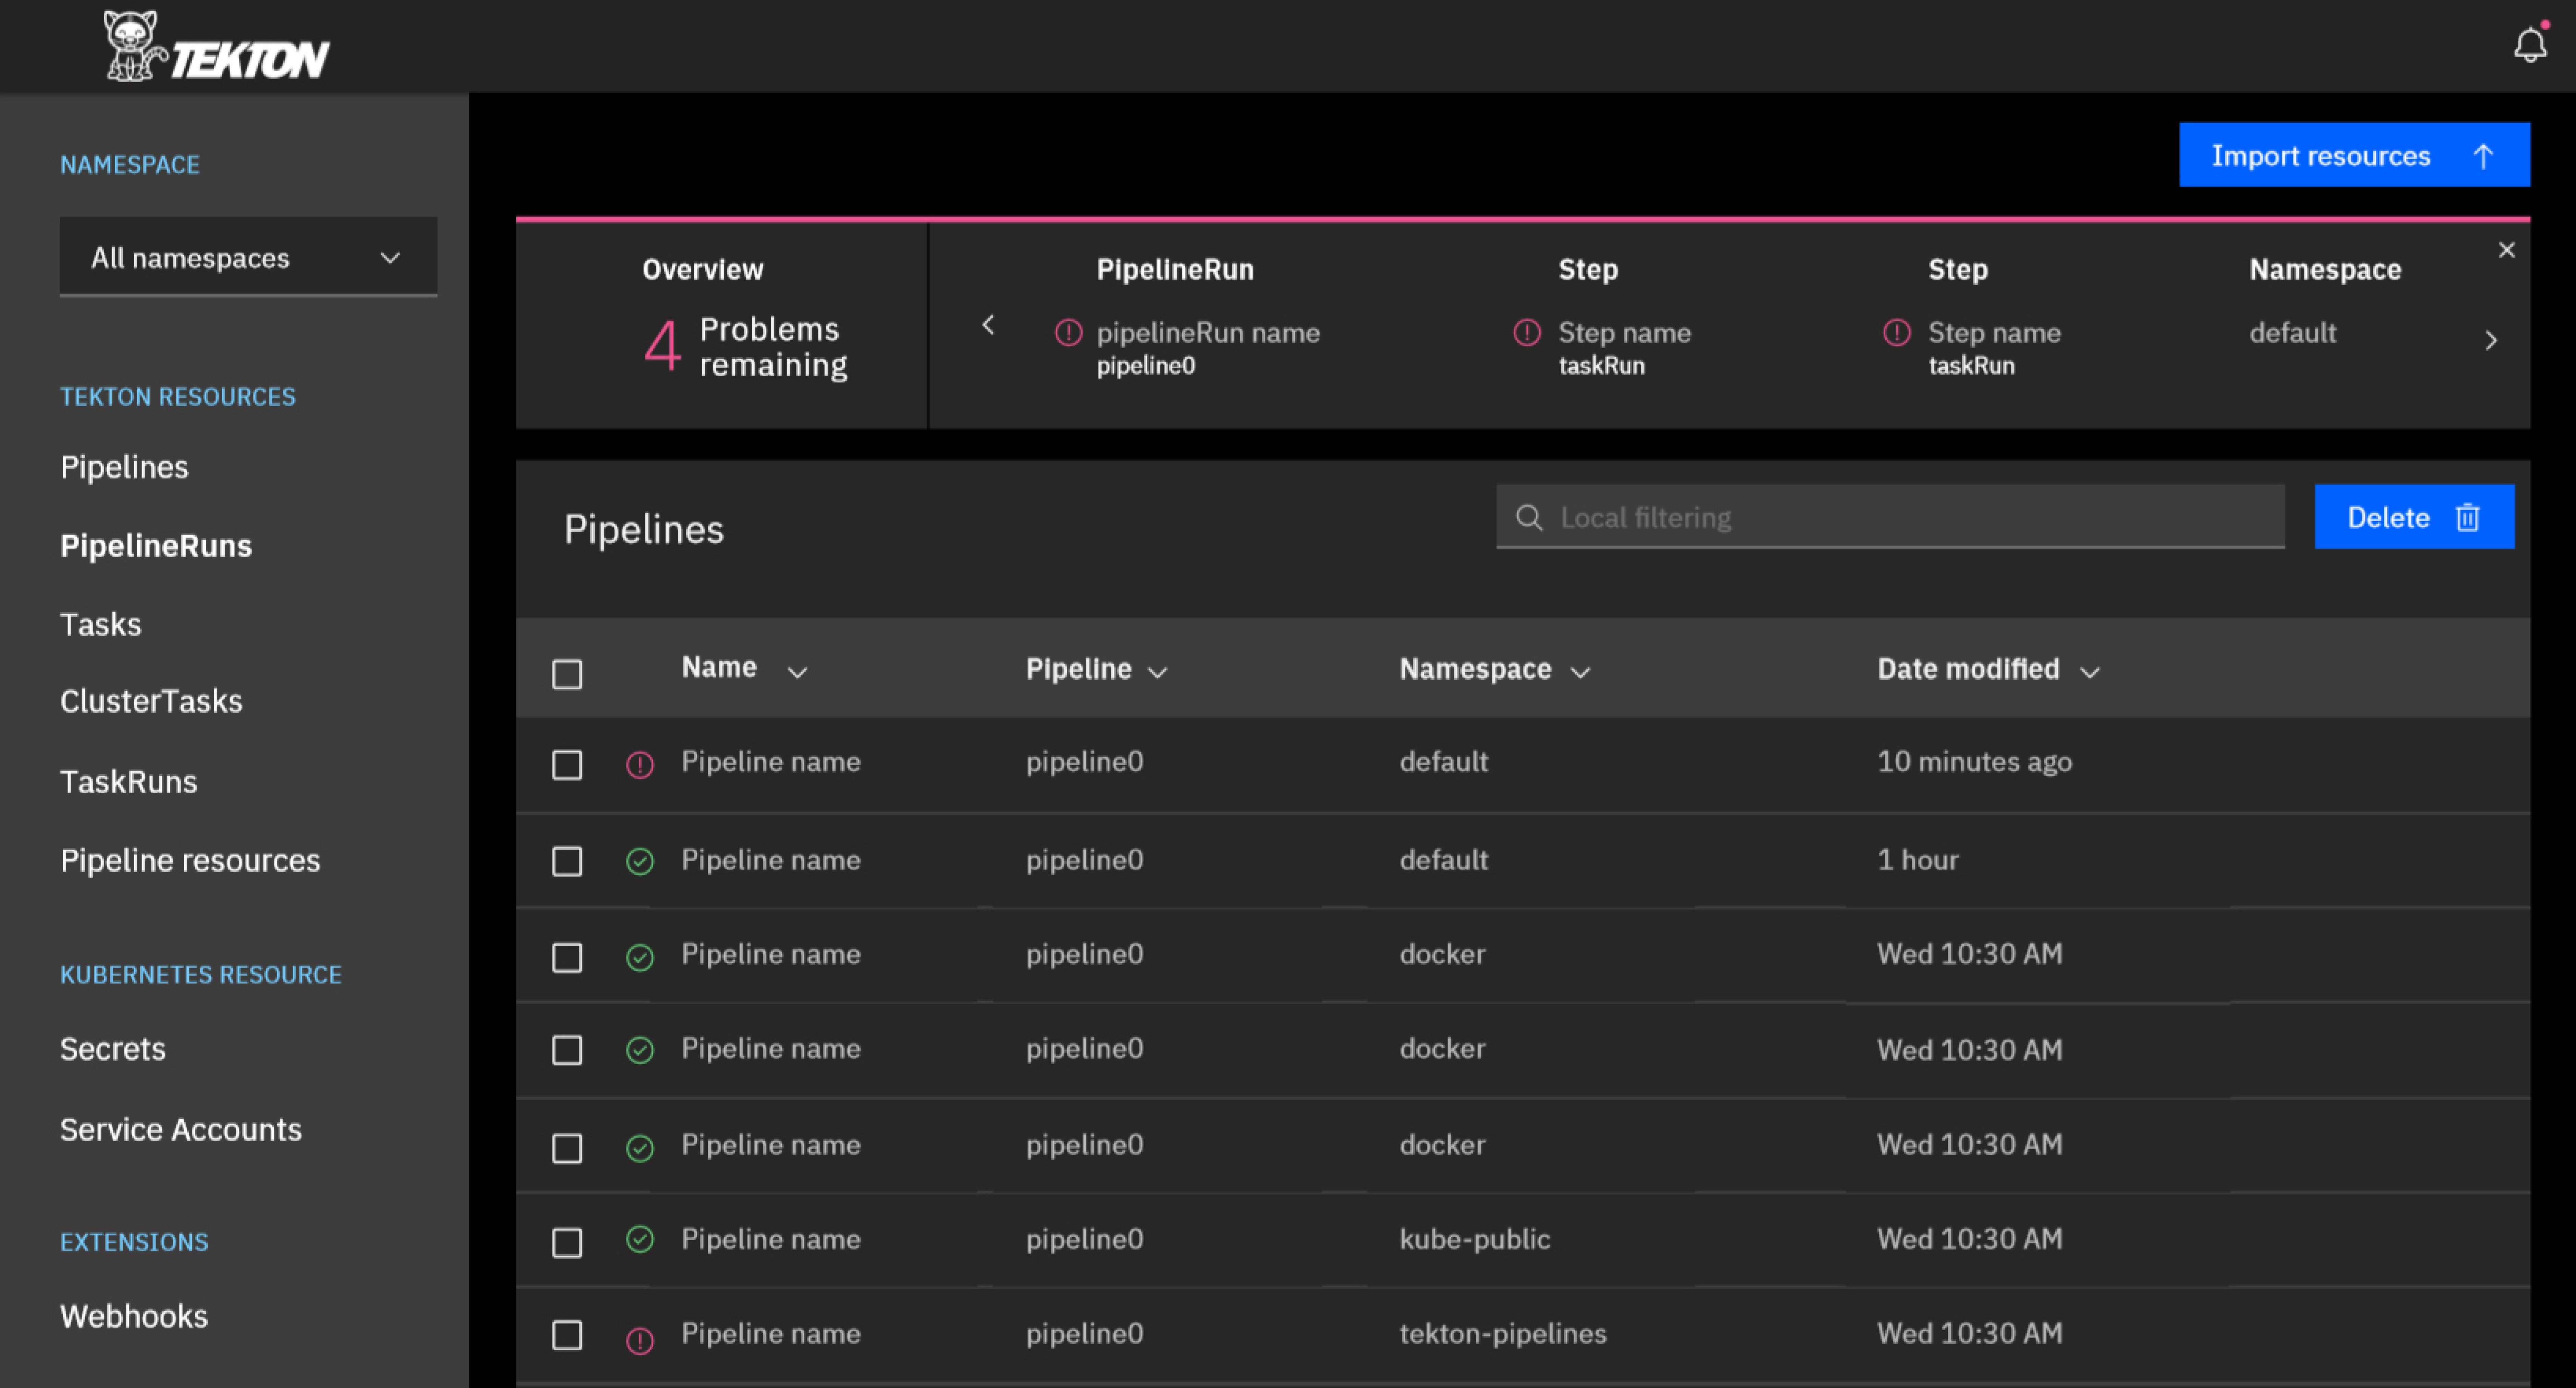
Final Visual Design
These high resolution mockups featured here were provided by Alexandra Grossi, the visual designer for this project. I'm showing it here because that was the design that set the tone for "disco mode." Disco mode, sadly, was not implemented while I was on the team, although it may have been since. To see the current implementation, please go to tekton.dev
Light Mode
Disco Mode